Pausing to look at the numbers, note thecountries shaded in green, which are the cheapest in the world, at least on aprice to book basis, are concentrated in Africa and Eastern Europe, arguably among the riskiest parts of the world. The mostexpensive countries are China, a couple of outliers in Africa (Ivory Coast andSenegal, with very small sample sizes) and Argentina, a bit of a surprise.
我们暂停一下看看图中的数字,注意:绿色标记的地域其股价在世界范围内是最低的,至少基于市净率来看是这样,这部分区域主要集中在非洲和东欧,这些地方可以说是世界上风险最大的地区。股价最高的地方是中国以及非洲大陆外缘的一些地方(像象牙海岸和塞内加尔这些地方,样本量很小),还有阿根廷,有些出人意料之外。
EV to EBITDA
EV/EBITDA比率
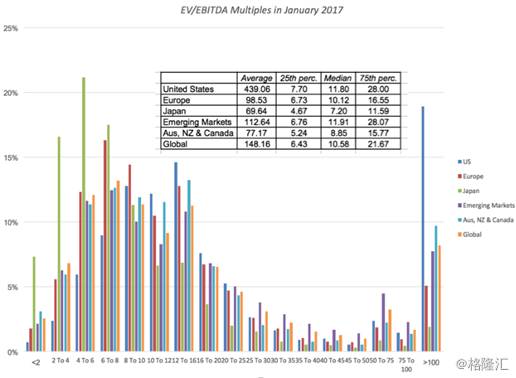
The EV to EBITDA multiple has quicklygrown in favor among analysts, for some good reasons and some bad. Among thegood reasons, it is less affected by different financial leverage policies thanPE ratios (but it is not immune) and depreciation methods thanother earnings multiples.
Among the bad ones is that it is a cash flow measurebased on a dangerously loose definition of cash flow that works only if youlive in a world where there are no taxes, debt payments and capitalexpenditures laying claim on those cash flows.
The global histogram of EV toEBITDA multiples share the positive skew of the other multiples, with the peakto the left and the tail to the right:
EV/EBITDA比率在分析师中的迅速走俏,其中有好有坏。好在于/EBITDA相较于P/E而言受到财务杠杆策略的影响较小(但绝非完全免疫),较之于其它指标而言,EV/EBITDA受到不同折旧方法的影响也较小。
不好在于,这个现金流计算方法是基于对自由现金流为危险且松散的定义之下,只有在一个没有对自由现金流征收赋税、没有负债和资本开支的世界里才有用。EV/EBITDA的全球分布柱状图和其它比率有正相关走势关系,左边是高峰,右边是尾部。
Again, there will be firms that had negative EBITDA that did not make the cut, but they are fewer in number than those with negative EPS. Looking at the median EV to EBITDA multiple by country in the heat map below, you can see the cheap spots and the expensive ones.
同样,由于没有减税,也有EBITDA为负数的企业,但是这类企业还是比EPS为负的企业要少。从下面EV/EBITDA中位数的国家分布图可见哪些地方的股价便宜,哪些地方的股价贵。
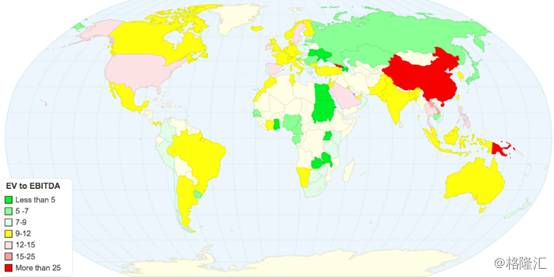
As with price to book, the cheapest countries in the world lie in some of the riskiest parts of the world, in Africa and Eastern Europe. China remains among the most expensive countries in the world but Argentina which also made the list, on a price to book basis, drops back to the pack.
跟市净率一样,股价最便宜的地区在非洲和东欧,这也是是全世界风险最高的地区。在EV/EBITDA比率的基准之上,中国仍然位居全球股价最高的国家之列,不过阿根廷就落到了普通水平。
EV to Sales
EV/营收比率
If you share my fear of accounting game playing, you probably also feel more comfortable working with revenues, the number on which accountants have the fewest degrees of freedom. Let’s start with the histogram for global stocks:
如果你跟我一样也担心会计的操控,那你应该会对营收这个数字更放心,因为会计在这个数字上能动的手脚是最小的。我们先来看看全球股票的柱状图:
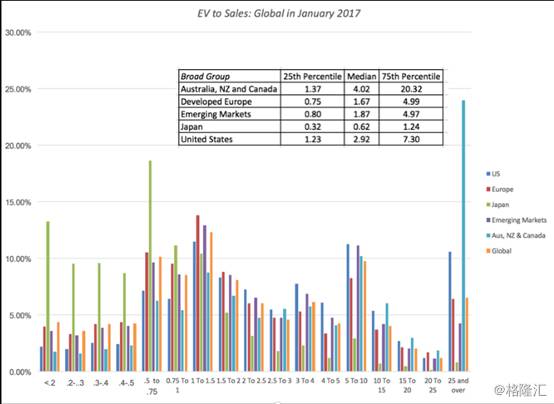
Of all the multiples, this should be the one where you lose the least companies (though many financial service companies don’t report conventional revenues) and the one that you can use even on young companies that are working their way through the early stages of the life cycle. The median EV/Sales ratio for each country are in the heat map below:
(虽然很多金融服务公司不披露传统的营收),但在所有比率之中,这一项大概是最不可能漏掉公司的一个,即便是处于成长初期的年轻的公司也是能用这个比率的。EV/营收比率的中位数国家热量分布图如下:
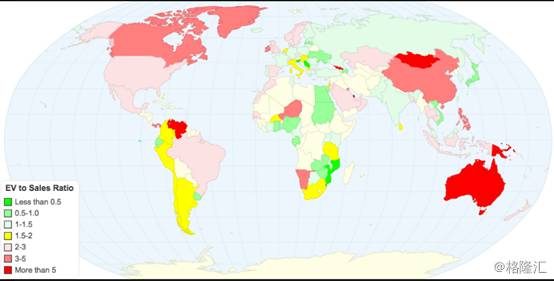
By now, the familiar pattern reasserts itself, with East European and African companies looking cheap and China looking expensive. With revenue multiples, Canada and Australia also enter the overvalued list, perhaps because of the preponderance of natural resource companies in these countries.
转载请注明出处。
 相关文章
相关文章 精彩导读
精彩导读

 热门资讯
热门资讯 关注我们
关注我们
