为了看看在2017年初全世界的股票价格如何,我关注了四个指标,市盈率(P/E),市净率(P/B),企业价值(EV)/营收,还有企业价值(EV)/EBITDA。我们以几张展示了全球股票价格的柱状图依次谈谈每一个指标,然后在热量地图上展示具体一些国家的股票价格。
PE ratio
市盈率
The PE ratio has many variants, some related to what period the earnings per share is measured (current, trailing or forward), some relating to whether the earnings per share are primary or diluted and some a function of whether and how you adjust for extraordinary items.
If you superimpose on top of these differences the fact that earnings per share reported by companies reflect very different accounting standards around the world, you can already start to see the caveats roll out. That said, it is still useful to start with a histogram of PE ratios of all publicly traded companies around the world:
市盈率这个指标有很多变量,有些跟每股收益(EPS)的计算时间段有关(本期收益,持续收益,预期收益),有取决于是普通EPS还是稀释后的EPS,有些取决于你如何调整非经常性项目。
除了这些变量,如果你还认识到公司披露出的EPS反映的是世界各地各不相同的会计准则,那么你就能看到危险信号出现。也就是说,从研究世界各地上市公司的P/E比率着手是有意义的:
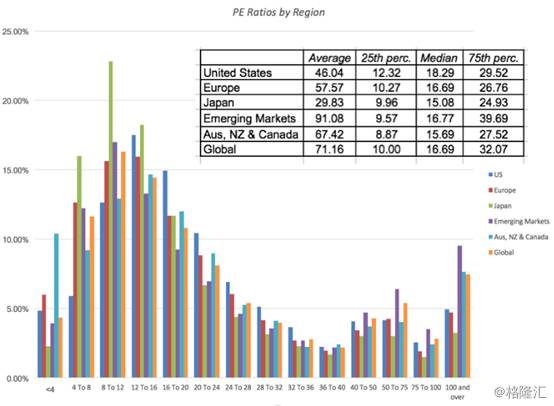
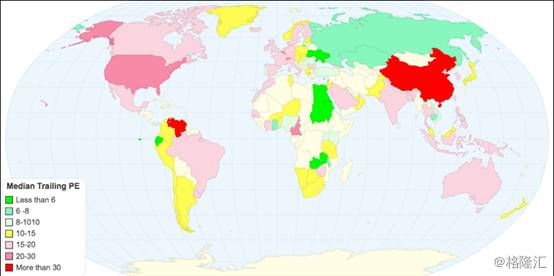
Note that of the 42,668 firms in my global sample, there were only 25,493 firms that made it through into this graph; the rest of the sample (about 40%) had negative earnings per share and the PE ratios was not meaningful. While the histogram provides the distributions by regional sub-groups, the heat map below provides the median PE ratio by country:
留意:在全球42668家样本公司中,只有25493家被录入上图中;其它的样本的(大约有40%的公司)EPS为负数,所以其P/E并无意义。上面这幅柱状图展示了按照地域划分P/E分布,下面的热量图展示了各个国家的P/E中位数。
I mistrust PE ratios for many reasons. First, the more accountants can work on a number, the less trustworthy it becomes, and there is no more massaged, manipulated and mangled variable than earnings per share. Second, the sampling bias introduced by eliminating a large subset of your sample, by eliminating money losing companies, is immense. Third, it is the most volatile of all of the multiples as it is based upon earnings per share.
我不信任P/E指标的原因有很多。首先,越是会计能动手脚的数字,这个数字的可信度就越小,没有什么变量比EPS还容易被操控篡改的了。其次,由于消除了大部分样本和亏损的公司之后,形成了极大的样本偏差。最后,由于P/E指标的基础是EPS,所以P/E是所有指标里面最不稳定的。
Price to Book
市净率
In many ways, the price to book ratio confronts investors on a fundamental question of whether they trust markets or accountants more, by scaling the market’s estimate of what a company is worth (the market capitalization) to what the accountants consider the company’s value (book value of equity).
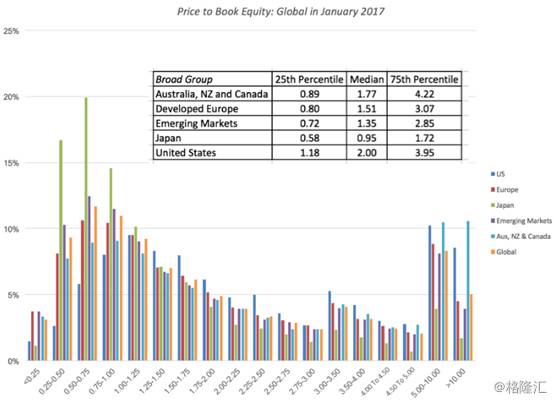
The rules of thumb that have been build around book value go back in history to the origins of value investing and all make implicit assumptions about what book value measures in the first place. Again, I will start with the histogram for all global stocks, with the table at the regional level imposed on it:
很多时候,市净率都将投资者置身于这样一个本质问题当中:从市场对公司的估值(市值),到会计认为公司值多少,投资者究竟是相信市场多一点,还是相信会计多一点。这一围绕市净率形成的首要规则可以追溯到价值投资的起源时期,大家对账面价值最开始衡量的是什么进行含糊的假设。我们还是以一张全球股票的柱状图开始,另附上一张地域图表。
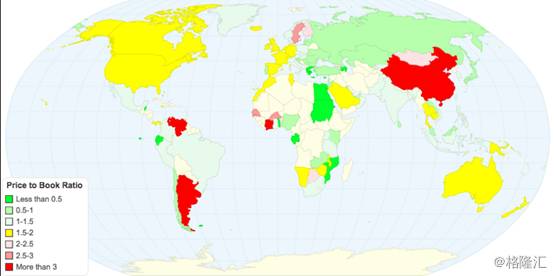
The price to book ratio has better sampling properties than price earnings ratios for the simple reason that there are far fewer firms with negative book equities (only about 10% of all firms globally) than with negative earnings. If you believe, as some do, that stocks that trade at less than book value are cheap, there is good news: you have lots and lots of buying opportunities (including the entire Japanese market). Following up, let’s take a look in the heat map below of median price to book ratios, by country.
由于账面所有者权益为负的公司极少(全球只有10%),所以市净率的样本公司数据比市盈率的要多。跟有些人一样,如果你觉得股价的交易价格低于其账面价值就算便宜了,那么有一个好消息:你有十分十分多的买入机会(整个日本股市都涵盖其中)。现在我们看看下面的按国家划分的市净率热量分布地图。
转载请注明出处。
 相关文章
相关文章 精彩导读
精彩导读

 热门资讯
热门资讯 关注我们
关注我们
