A Definitive Guide to Chinas Economic Cycle(2)
2017-03-24 编辑:
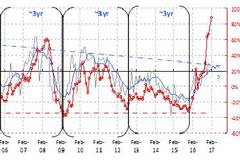
We derive our 3-year investment cycle by measuring the deviation of the actual property investment growth data from its long-term trend. There are four and a half, very clearly defined 3-year cycles: 2003-2006, 2006-2009, 2009-2012, 2012-2015, and last quarter of 2015 till now. We then compare the investment cycle with the rebar price cycle and China’s interest rate cycle. We can demonstrate that these various cycles are closely correlated (Focus Chart 1). That is, the 3-year investment cycle can explain the movements in Chinese asset prices.
Focus Chart 1: The 3-year Inventory investment cycle versus rebar price and long-bond yield.

China’s 3-year cycle is indeed a property inventory investment cycle.Even though China’s cycles are clearly demonstrated in charts, an obvious question begging to be asked is that why the cycle lasts three years? We believe the duration of the cycle is related to the building construction cycle. To construct a 30-storey residential building, the building completion time is around 9-12 months, water and electrical installation around 3 months and plus some more time for safety inspection and miscellaneous approvals. The total time to completion is around 1.5-2 years. Then the building inventory will take up to 1 year to clear, making the building inventory investment cycle to be around 3 years.
As the current investment cycle peaks, the momentum in economic recovery will soon wane, together with the demand for commodity. Bond yield’s strength will weaken, too, as inflation pressure slowly dissipate, and the demand for safe yield in a risk-averse environment grows.
China’s stock market cycle and M1 lead the investment cycle by ~3 months. That said, the relationship between the investment cycle and Chinese stock market is not as tight. Indeed, Chinese stocks tend to lead the investment cycle by around 3 months, although stocks show an inverse relationship with the cycle during the 2015 market bubble (Focus Chart 2). Meanwhile, we can show a more consistent relationship between China M1 narrow money supply growth and the 3-year investment cycle, with a 3-month lead (Focus Chart 2). For equity investors, our task is not only to decipher the cycle within the Chinese economy and its relationship with asset prices, we must also postulate what leads the investment cycle and asset price cycle to earn an edge to trade stocks.
Focus Chart 2: China’s stock market cycle and M1 lead the investment cycle by ~3 months.


The Four Economic Cycles
Cycles can be used to detect inflection points.The term “cycle” suggests regularity, implying that economic variables fluctuate around a long-term trend with well-defined length and amplitude. In reality, of course, economic variables can be fickle and trends can be transient. The eventual realization of a visible trend, after much volatility, can easily outlast the transient memories and the career of many market researchers. And even if trends eventuate, their length and strength will vary considerably.
But these challenges have never stopped economists from their endeavor to decipher economic cycles and trends from data. In fact, the significance of any cyclical models is to identify turning points, especially for market participants. The timing of the cycle’s peak and trough will mean profit or loss for traders. But the reason less so. Usually, doubts arise as there appears to be little theoretical explanations for the alleged cycles, despite clear data evidence.
The four economic cycles of various lengths. There are four cycles. In the order of length, these cycles are: 1) the Kitchin Inventory Cycle (3-5 years); 2) the Juglar Investment Cycle (7-11 years); 3) the Kuznets Building Cycle (15-25 years); and 4) the Kondratieff Basic Capital Goods Cycle. Roughly, 1 Kondratieff = 3 Kuznets = 6 Juglar = 12 Kitchins, as Schumpeter suggested. The cycles are intertwined and interweaved. “Every cycle of higher order may be considered as the trend of the cycle of the next lower order” (Schumpeter, 1939). Upswing and downswing are defined relative to trend. Data can show an uptick for a particular month or quarter within a down trend. The 3-year property inventory investment cycle in China we identify previously is akin to the Kitchin Cycle, and it is peaking.